Curt Rekstad, Customer Support, Feb 2, 2021
On the heels of our recent pump performance chart video — part one comes, surprisingly enough, part two! If you haven’t viewed the first video, I encourage you to do so before diving into this one. Part one covers the basics of how to use the performance chart when evaluating various pump models and why the data you extract from it matters for your industry and application.
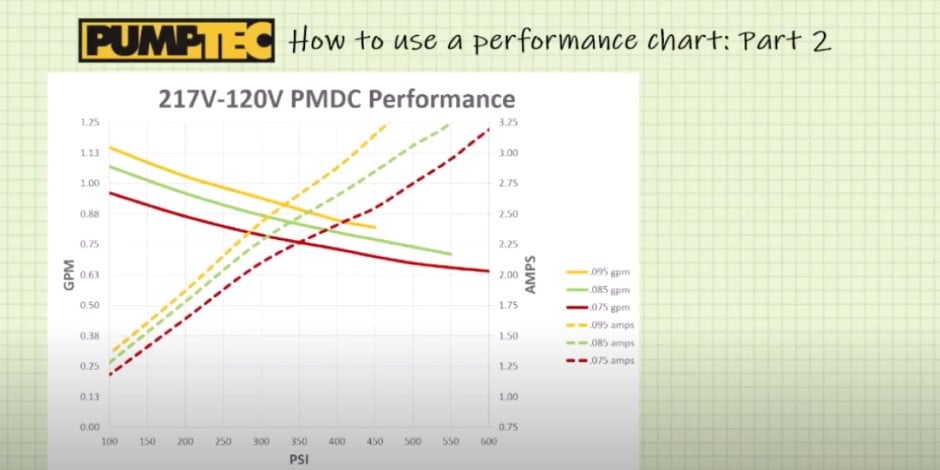
In part two, we dive a little deeper with a use case and how you can use the pump performance chart in real life. View the video below for a demonstration of how to determine your amps and gallons per minute (GPM) at different PSI, based on various cam sizes in our 217V pump series.
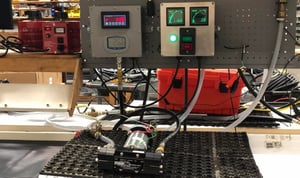
As a reminder, the performance charts displayed for each of our pump models document actual recorded data based on our stringent testing under multiple flow rates. Some pump manufacturers list performance data that is tabulated using theoretical formulas that don’t always translate to real world conditions and applications. When you view a Pumptec performance chart, what you see is what you get.
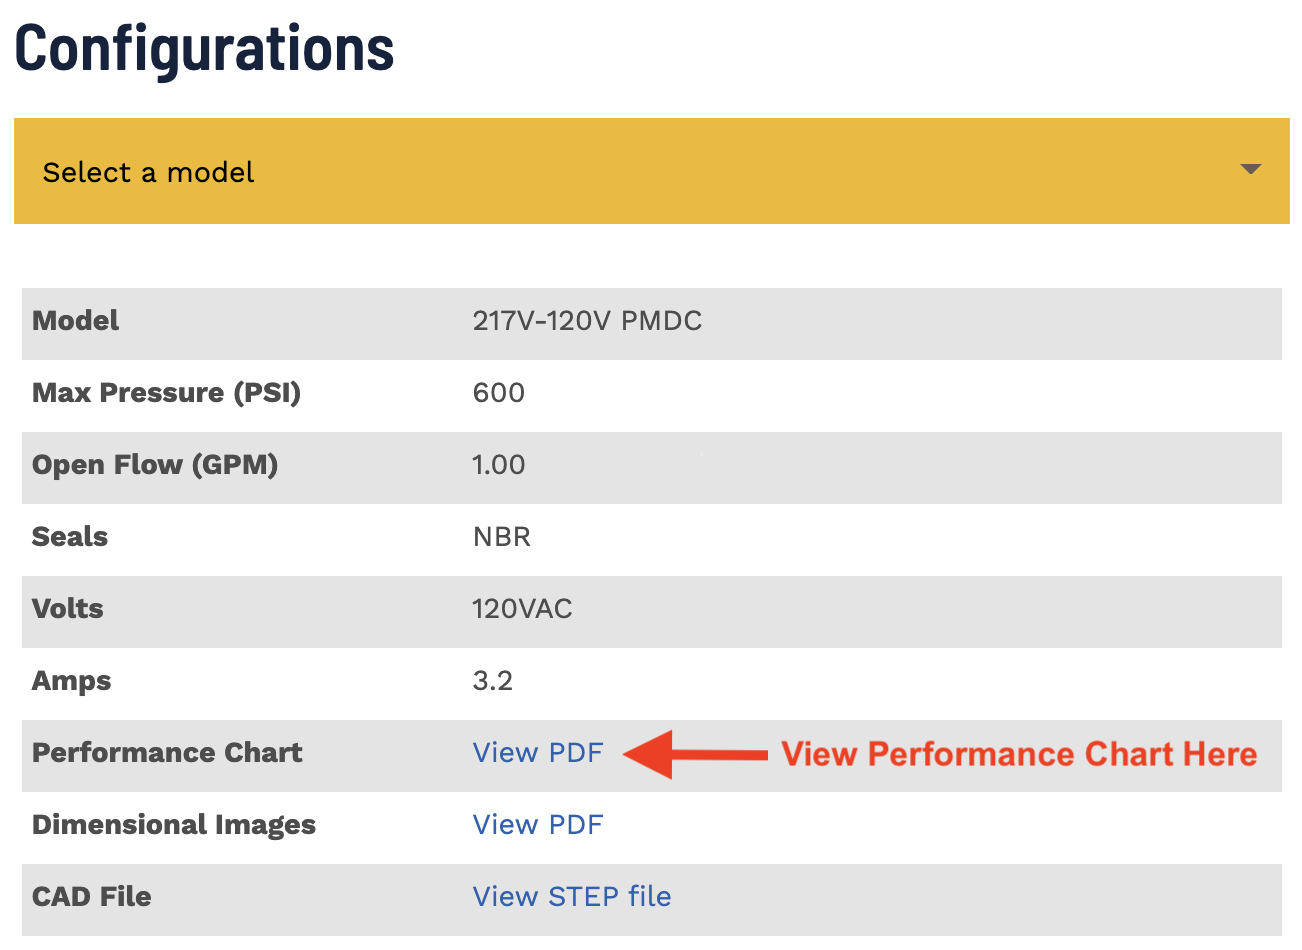 Find the Performance Chart listed under the Configurations section when viewing any Pumptec pump model.
To learn more about how to achieve the performance you want out of your pump sprayer or mister, use our Go-To Guide to Proper Pump GPM and PSI. Simply click the link below to access your copy.
Better yet, speak with one of our pump experts. They’ll ask questions you may not have even thought of and dig into your situation to overcome whatever application challenge you face.